Execute and Debug Pipeline
The NeoPilot Execute Pipeline and Check Logs agent enables users to run AI pipelines created in the Pipeline Builder and analyze their execution results. It provides a straightforward interface for selecting pipelines, configuring necessary inputs, and choosing AI providers for execution. Each pipeline execution generates a unique session ID, allowing users to access detailed logs that show exactly what happened during the process. This agent is essential for testing, debugging, and optimizing AI pipelines within the NeoPilot ecosystem.
NeoPilot - Execute Pipeline and Check Logs
Overview
The NeoPilot agent enables you to execute various pipelines and review their execution logs. This component streamlines the process of running AI-powered pipelines and provides detailed insights into their performance through comprehensive logging capabilities.
Key Terms
Term | Definition |
|---|---|
Session ID | A unique identifier is assigned to each pipeline execution. Think of it like a receipt number for your transaction—it helps the system track and reference your specific pipeline run among thousands of others. You can use this ID to look up the details of your execution later. |
Logs | Detailed records of what happened during your pipeline execution. Similar to a ship's logbook, these records capture every step, action, and error that occurred. Logs show you exactly what the system was doing at each moment, making them invaluable for troubleshooting when things don't work as expected. |
Pipeline | A sequence of connected components designed to process data and perform specific tasks automatically. In NeoPilot, pipelines combine various AI operations to achieve complex workflows. |
AI Provider | The company or platform that supplies the AI technology used in the pipeline (such as Claude, OpenAI, or Gemini). |
When to Use
When you need to execute an existing pipeline in the Pipeline Builder.
When you need to debug issues with pipeline execution.
When you need to identify the source of errors in your pipeline components.
Prerequisites
At least one pipeline is created and saved in the Pipeline Builder.
Step-by-Step Procedure
1. Access the Execute Pipeline and Check Logs Agent
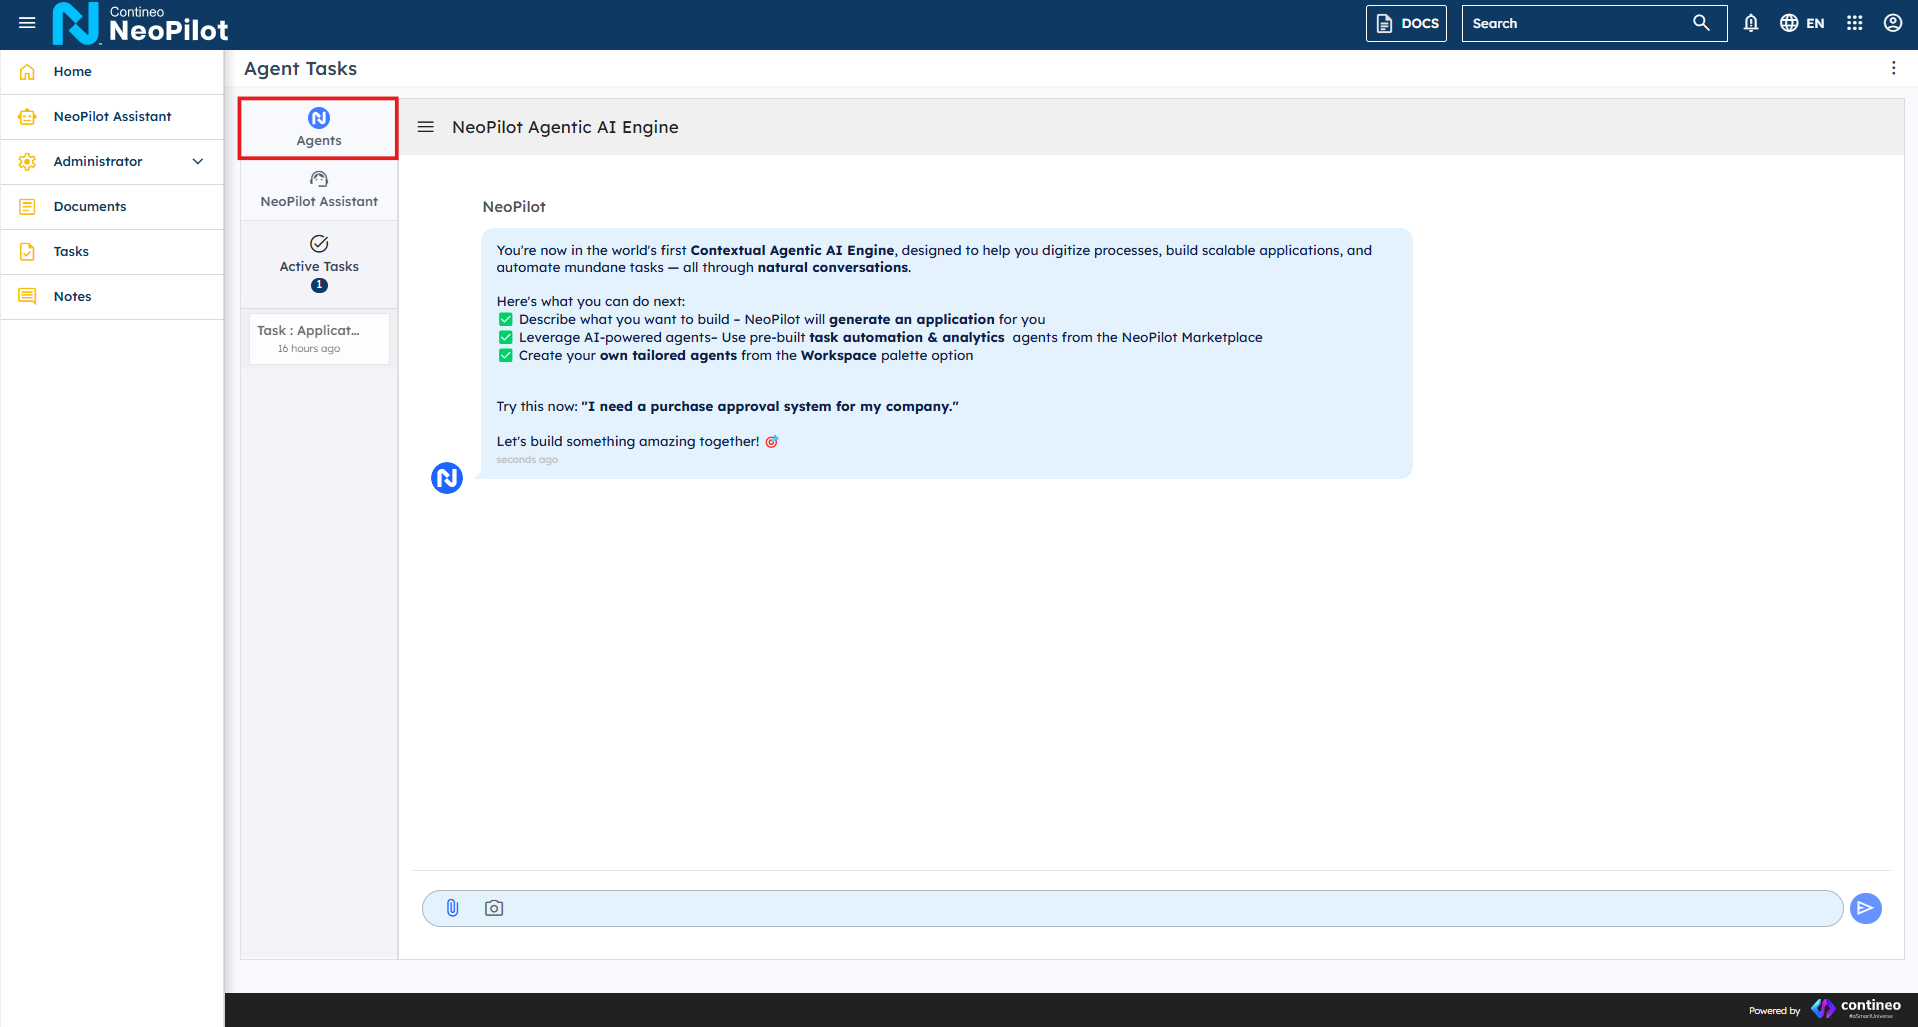
Log in to the NeoPilot web application.
From the left sidebar, locate and click NeoPilot Assistant or navigate to the main dashboard.
In the main interface, click the Agents tab (highlighted with the NeoPilot logo and "Agents" label).
Under the SAMPLE AGENTS section, find and click the Execute Pipeline and Check Logs agent (represented by a robot icon).
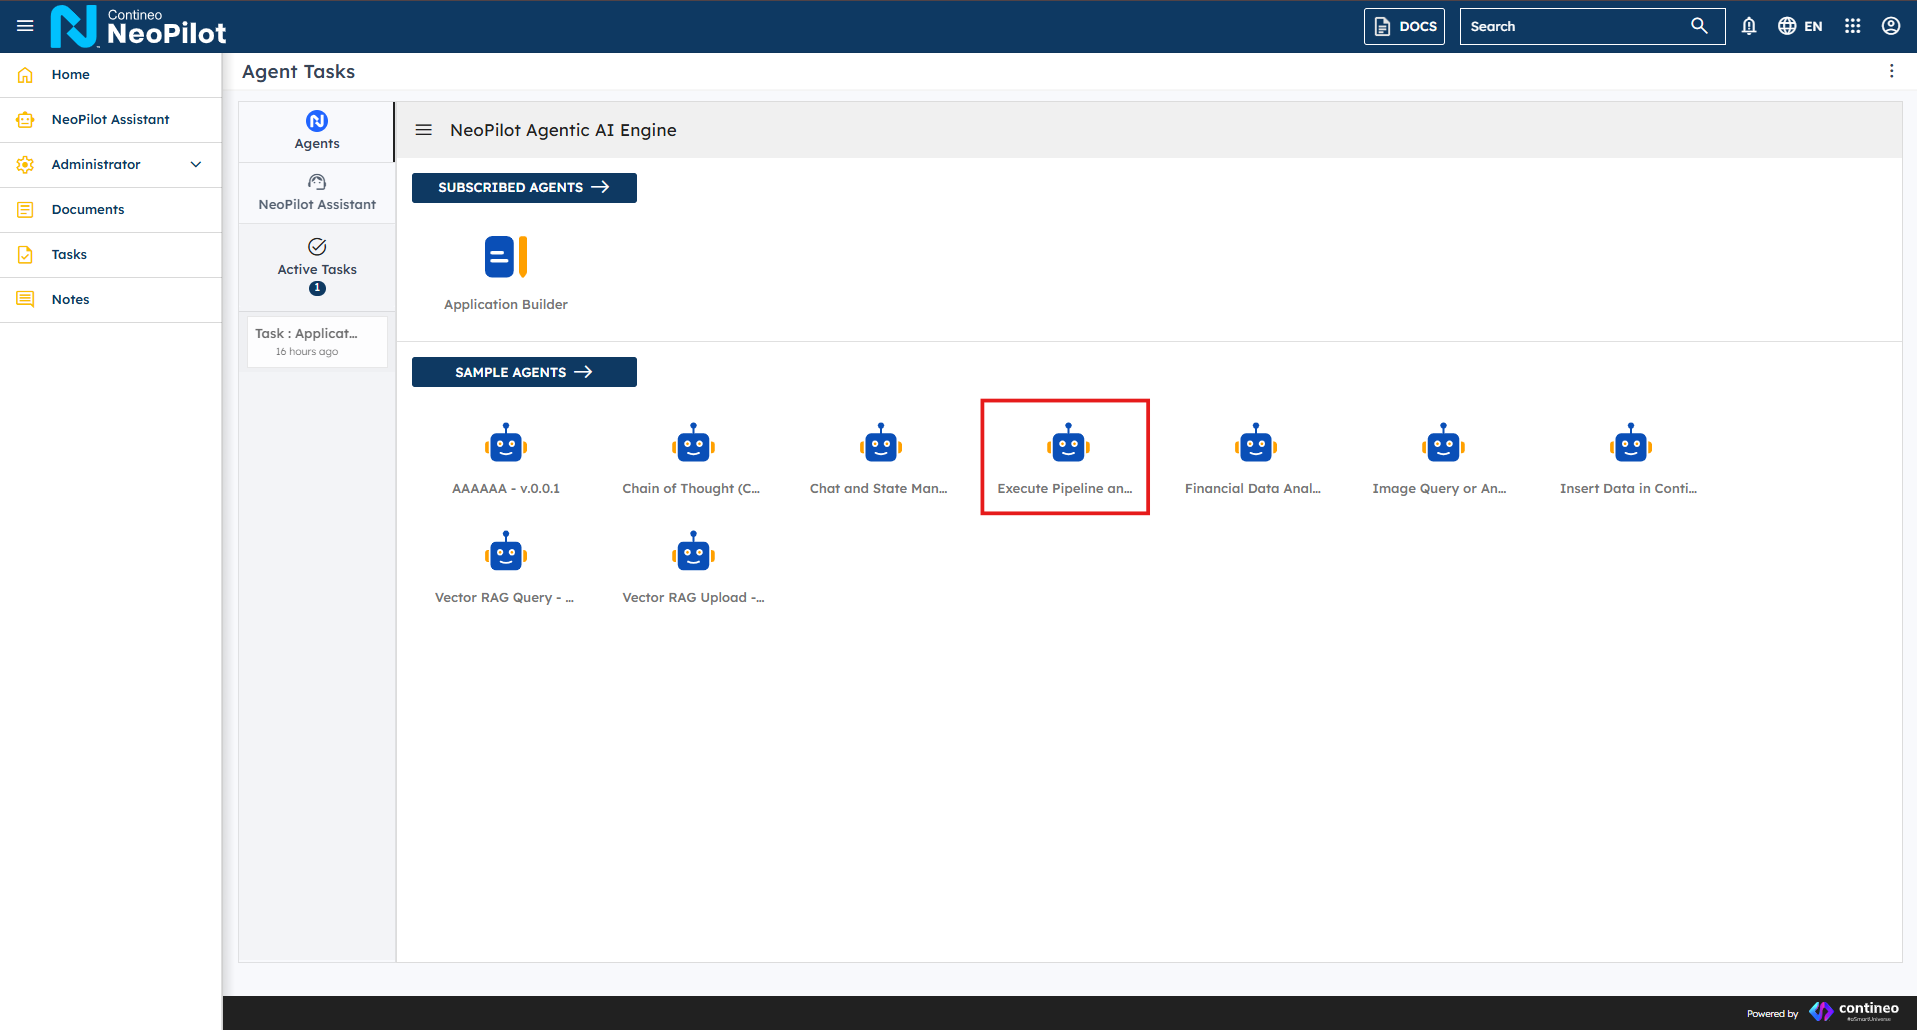
After clicking the Execute Pipeline and Check Logs agent, you are taken to the agent interface where you can proceed with executing pipelines and checking logs.
2. Execute a Pipeline
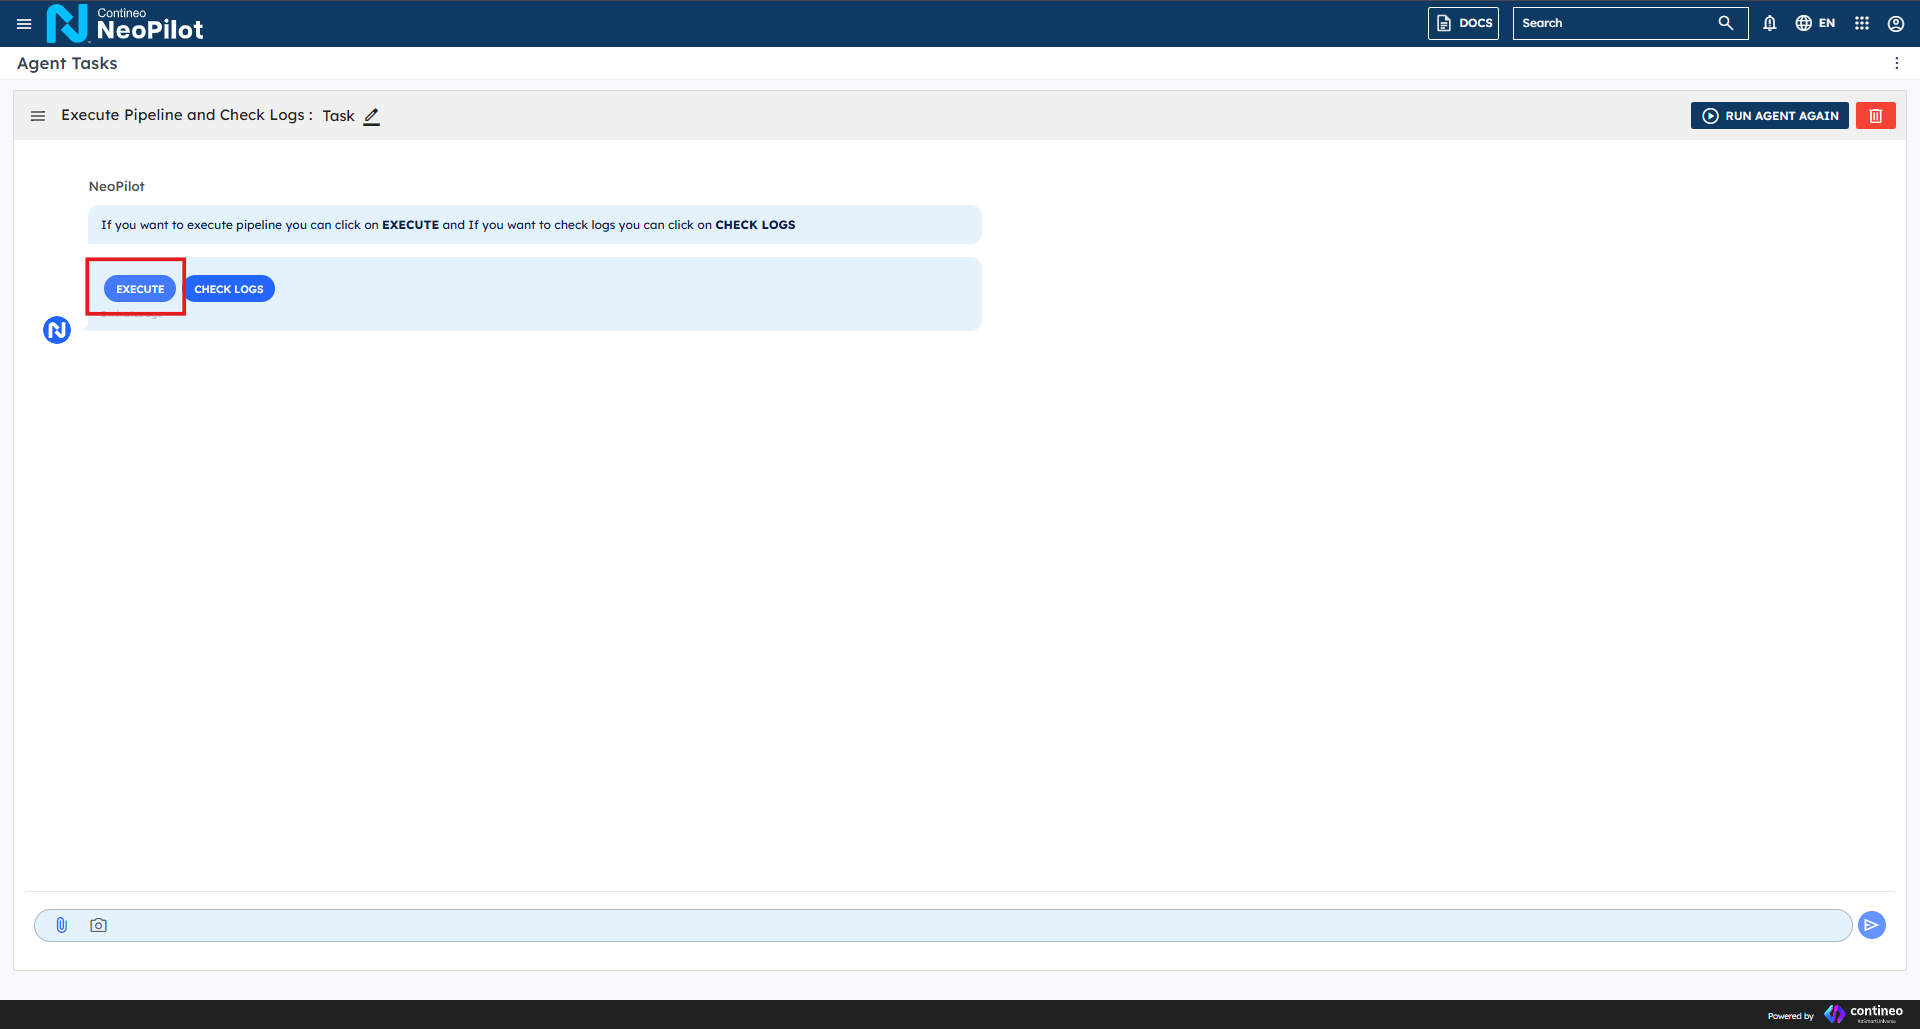
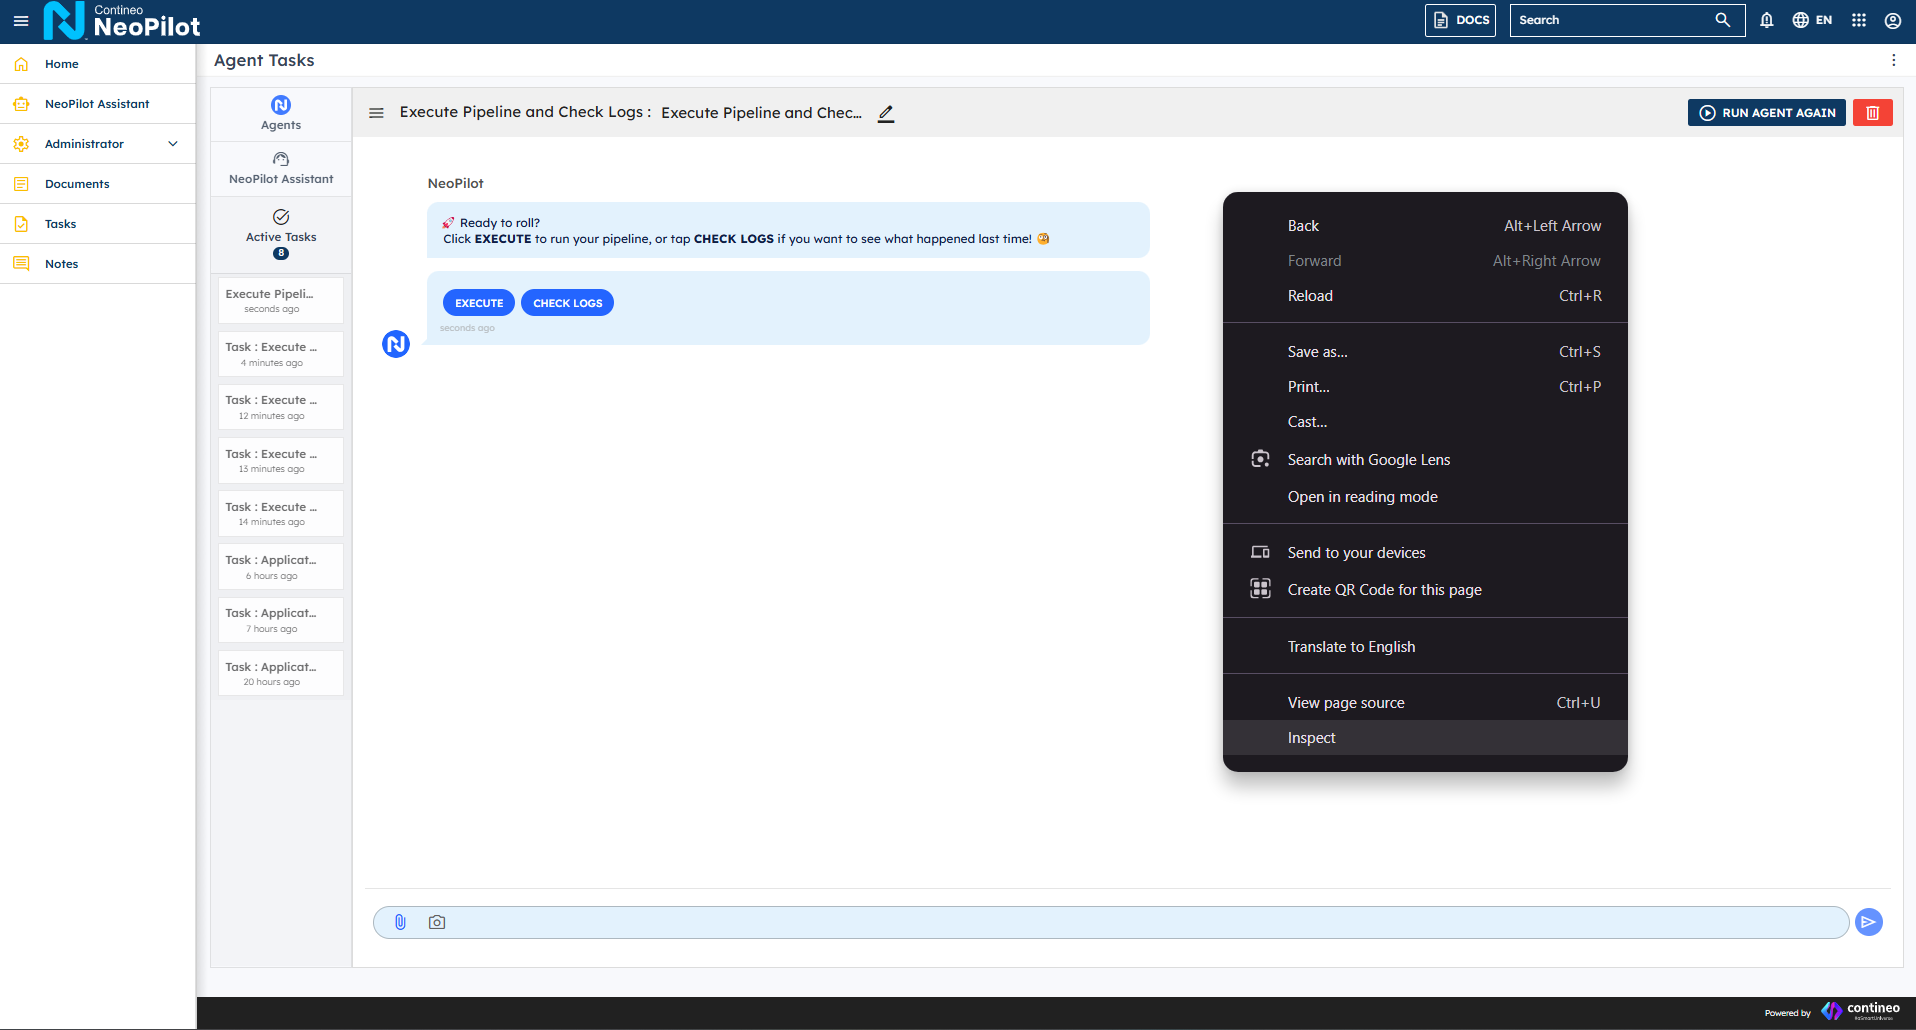
On the task page, you see two main options: EXECUTE and CHECK LOGS.
Click EXECUTE to begin the pipeline execution process.
Under Pipeline: Select the desired pipeline from the dropdown menu. The system displays available pipelines with their version numbers (such as "Sample pipeline for test - v.0.0.1")
{"input1":"sample_input","input2":"sample_input"}Enter any required inputs in the Inputs field.
Some pipelines may require numeric or text inputs based on their configuration.
For structured data, you can use JSON format. For example:
Important:
You must select the providers that were used when building the pipeline. The system verifies if you have registered API keys for the selected providers. If any API keys are not registered, a pop-up appears prompting you to register those missing API keys before proceeding.
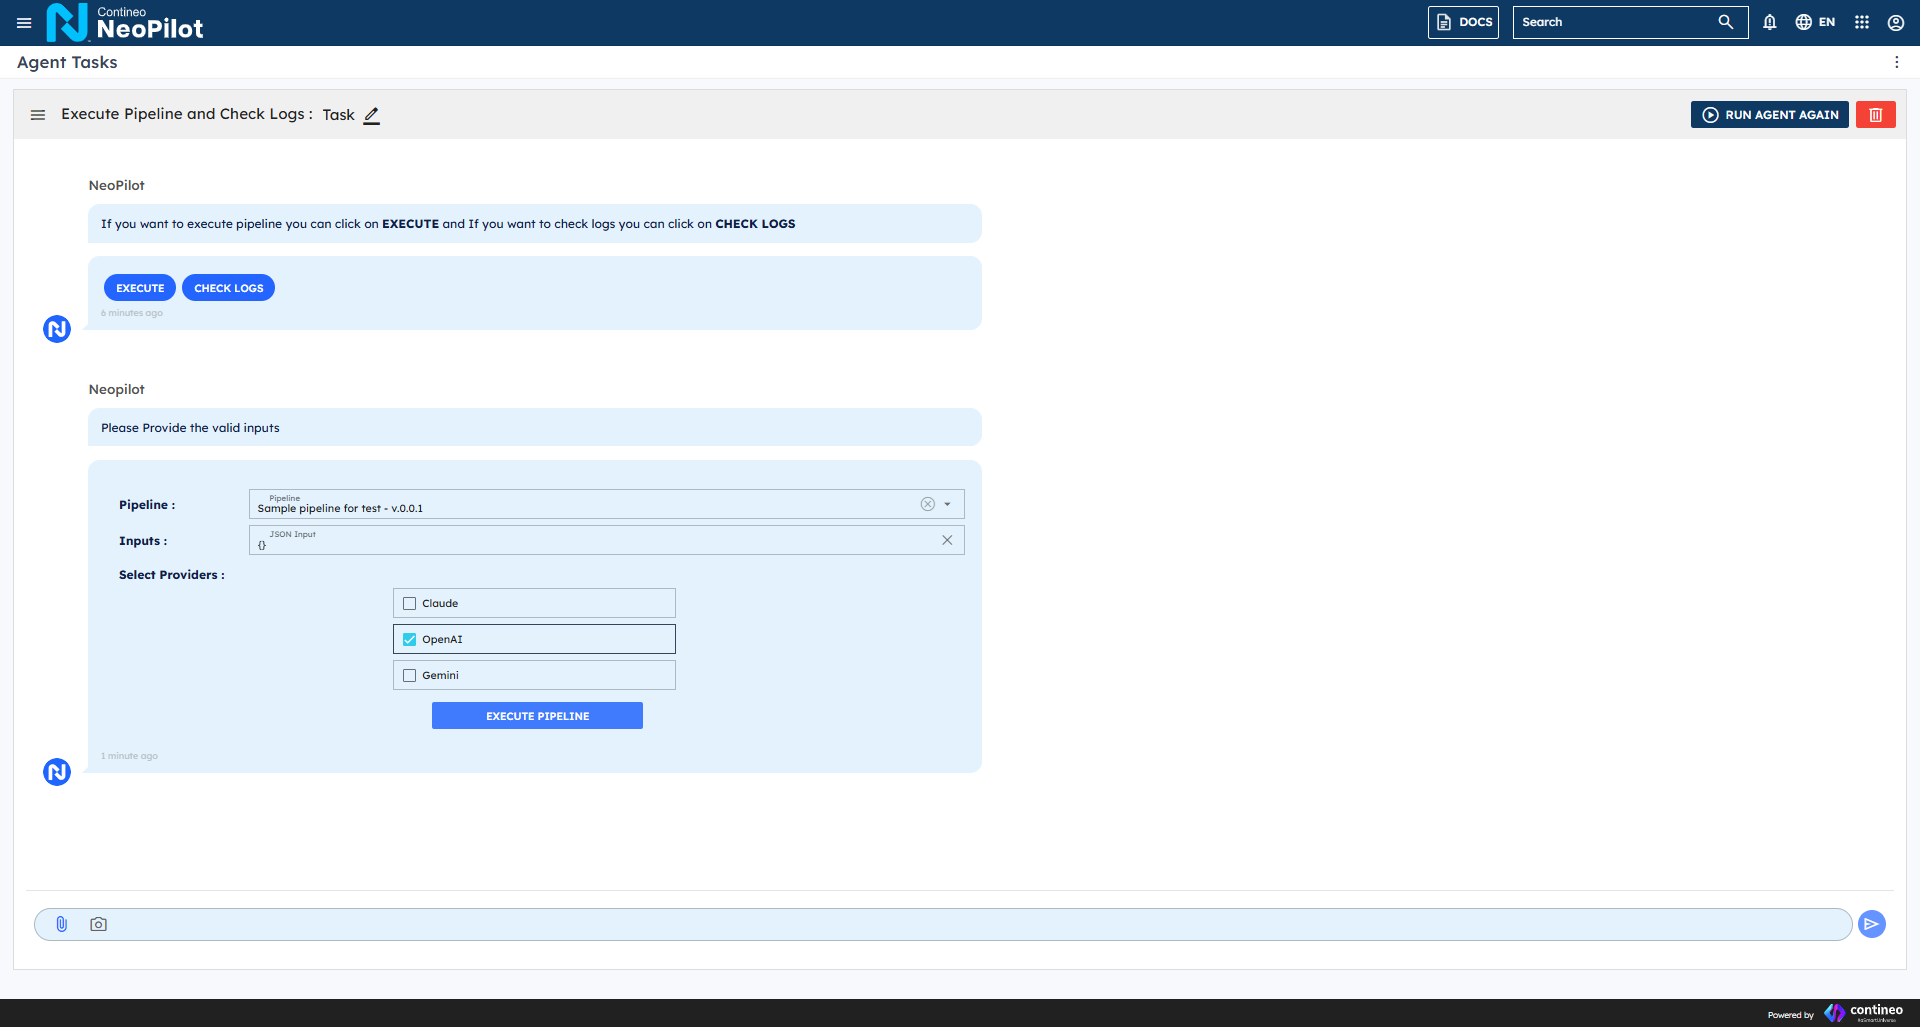
Under Select Providers, choose one or more AI providers by checking the corresponding boxes:
Claude
OpenAI
Gemini
Click EXECUTE PIPELINE to start the execution.
3. Monitor Pipeline Execution
The system begins executing the pipeline and displays a progress indicator.
Wait for the execution to complete. The execution time may vary depending on the complexity of the pipeline and the providers selected.
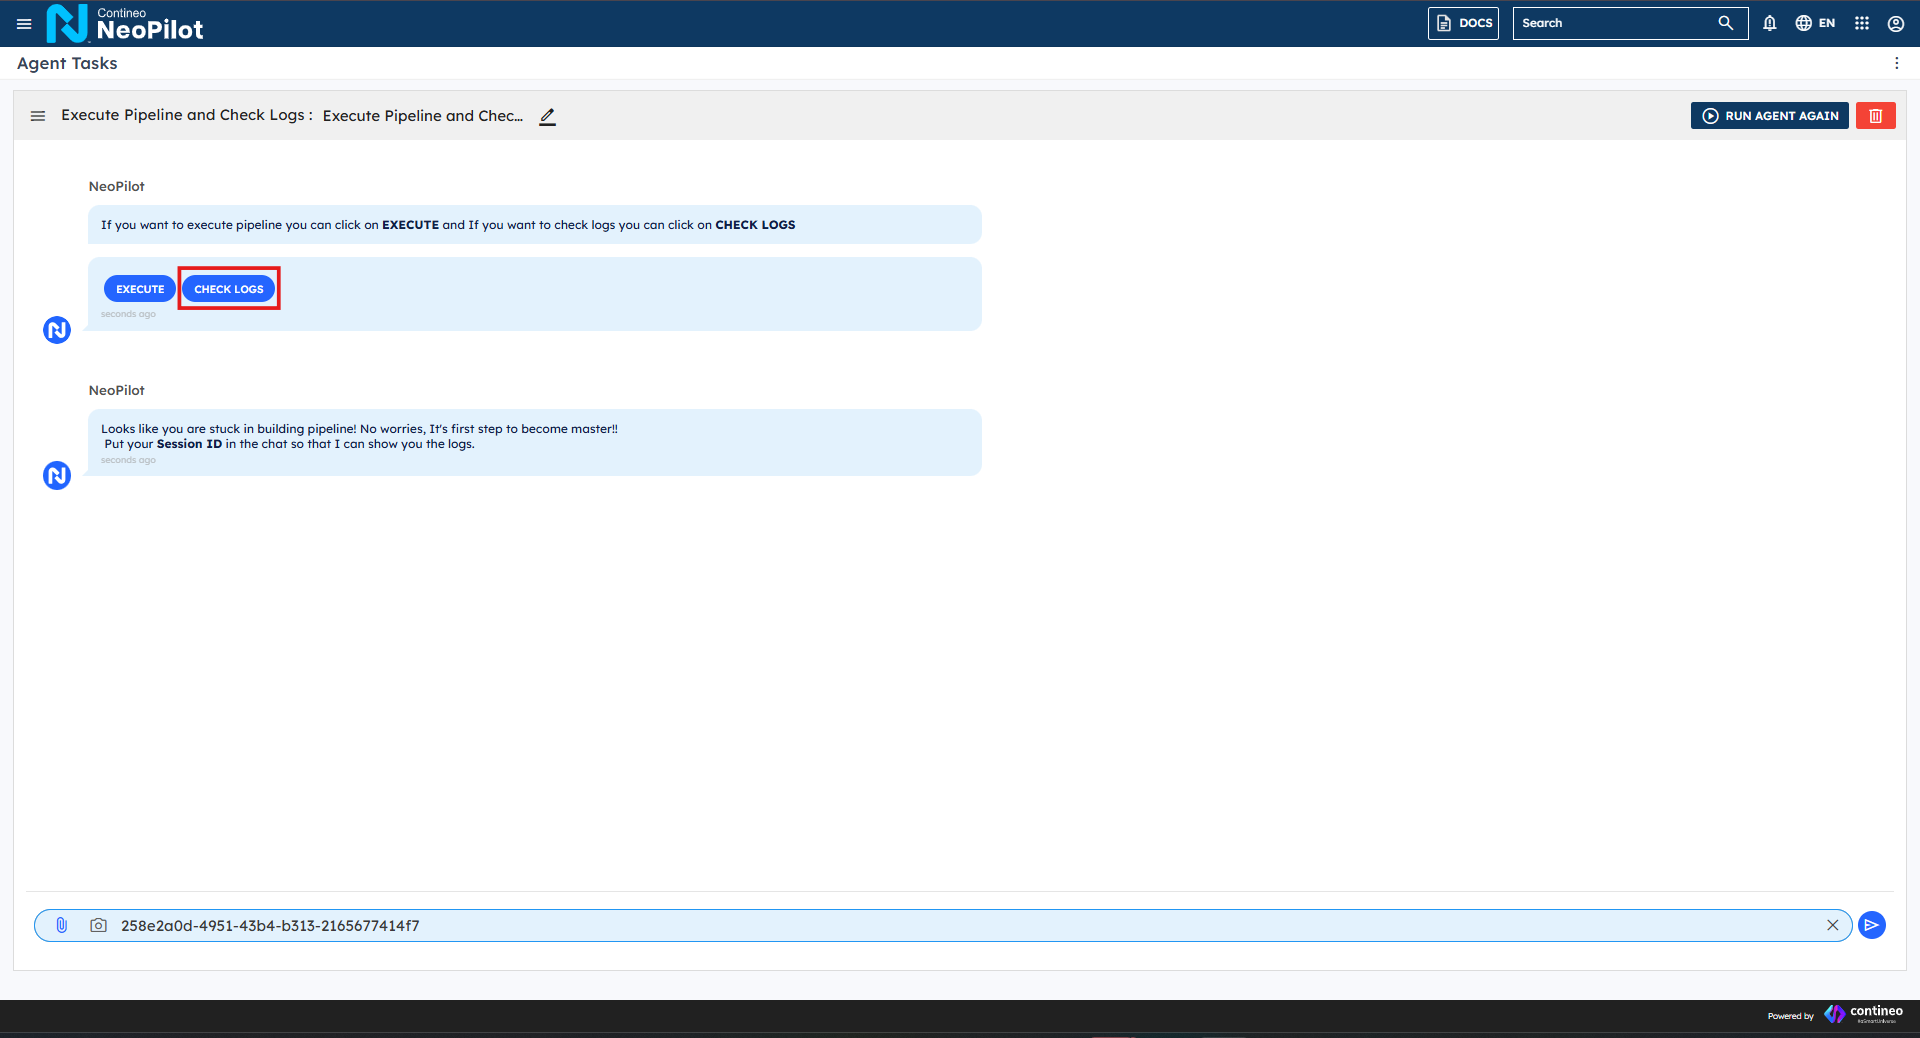
The session ID is generated and displayed at this stage (such as "258e2a0d-4951-43b4-b313-216567741417").
4. View Execution Results
After execution, the system displays the results or any errors encountered.
If successful, you see the pipeline's output as defined in the pipeline configuration.
If there are errors, an error message is displayed. Common errors include syntax errors in the pipeline components or invalid inputs.
The system automatically saves your execution results and logs, associated with your unique session ID.
5. Check Logs
To view detailed logs, click CHECK LOGS.
You can either:
Enter a previously generated session ID to view specific logs.
View the logs from your most recent execution.
The system displays comprehensive logs that include:
Timestamp of each action during execution.
Input and output values at each pipeline step.
Error details if any occurred, including:
Error type (such as "SyntaxError: Invalid syntax")
Component where the error occurred.
Traceback information showing the call stack.
Use CHECK ANOTHER LOG to view logs from different sessions.
How to Get Session ID for Debugging
Important:
This section specifically explains how to debug Gen AI pipelines when they are being executed through an agent. If you are using any agent and encounter issues with your Gen AI pipeline, follow these steps to retrieve the session ID for advanced debugging.
When an agent that uses a Gen AI pipeline experiences an unexpected halt or error during execution, you can retrieve the session ID directly from the browser's developer tools to help diagnose the issue.
Right-click anywhere on the page and select Inspect from the context menu
Run the agent and follow your normal workflow until an error or unexpected behavior occurs.
In the developer tools panel, select the Network tab.
Look for failed API requests (they typically be highlighted in red).
Click on the failed request and go to the Response tab.
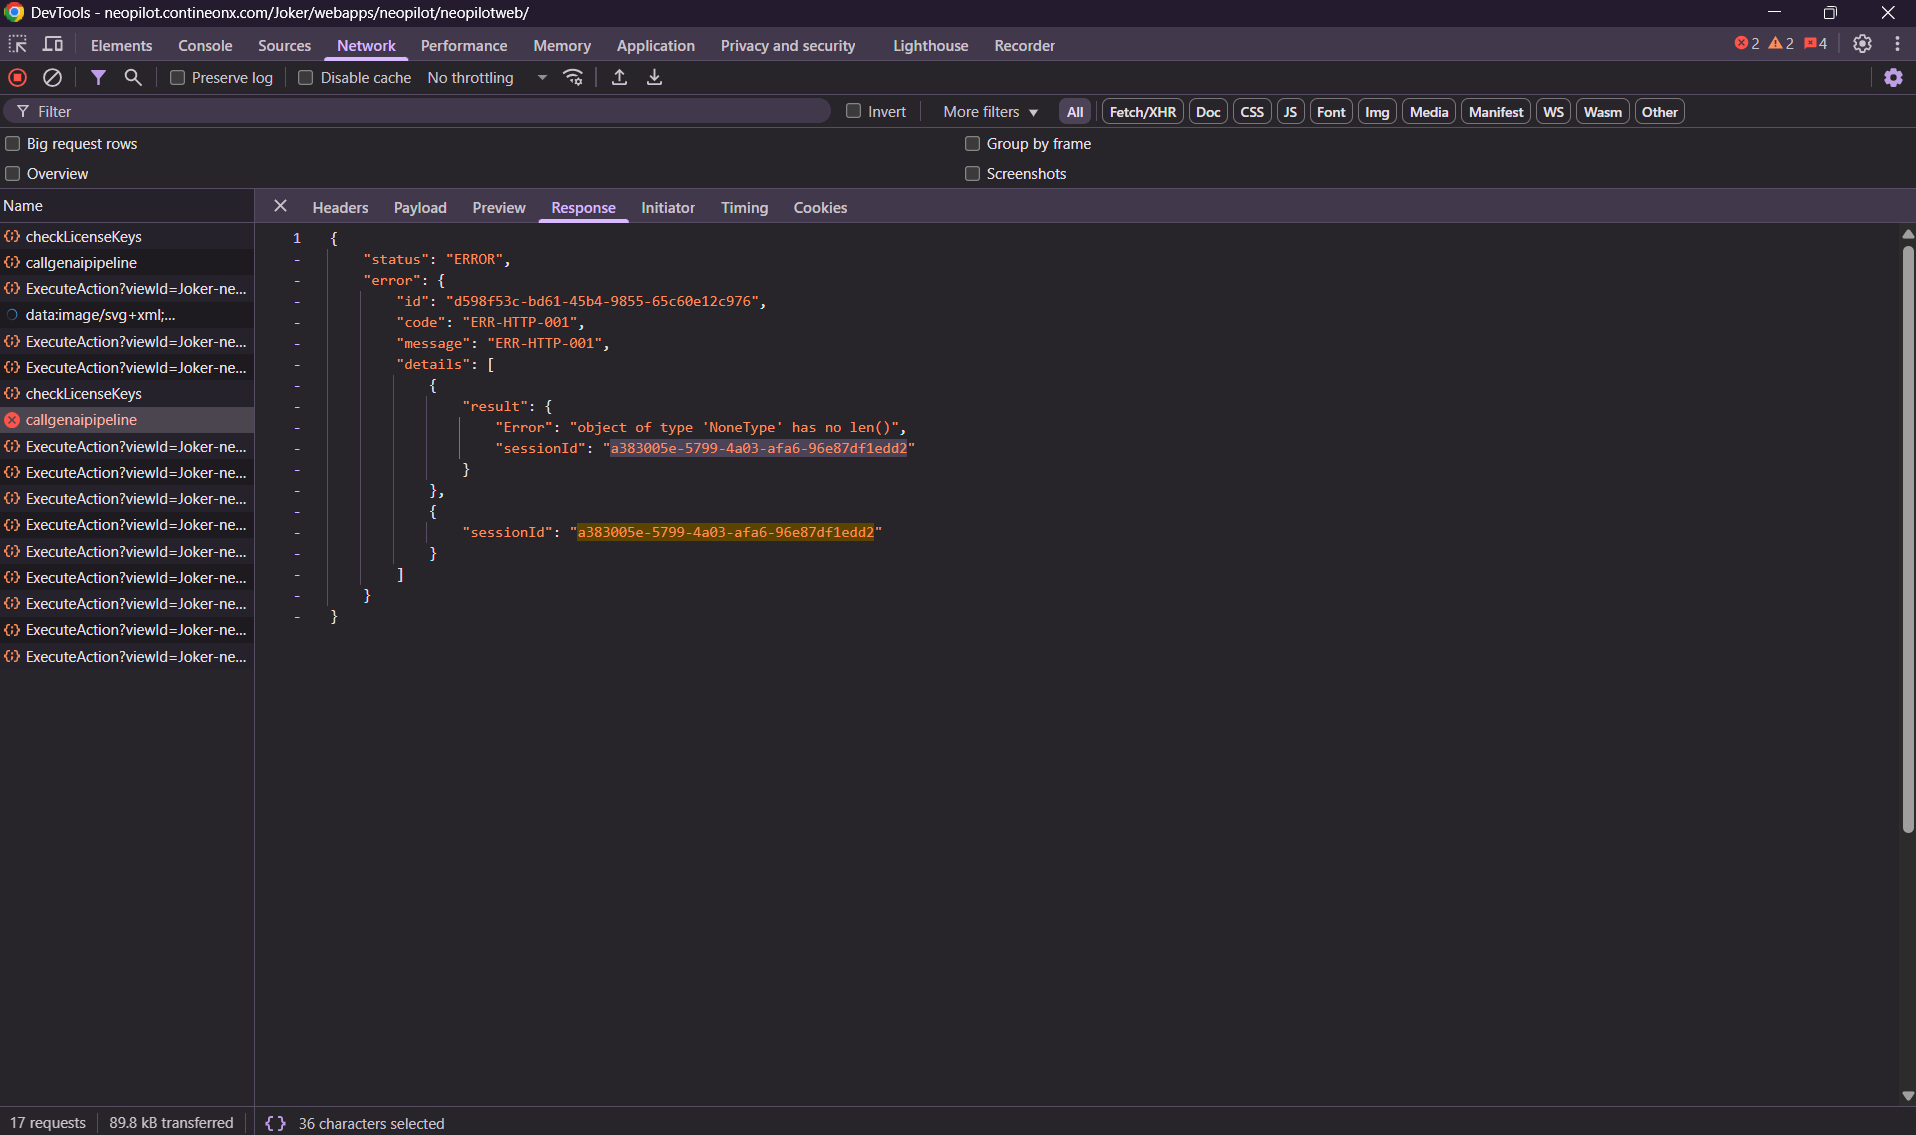
You find the session ID in the response JSON, typically listed as sessionId.
Use this session ID in the CHECK LOGS as mentioned above in the Execute Pipeline and Check Logs agent to investigate the specific error.
Note:
This debugging method is specifically designed for troubleshooting Gen AI pipelines that are being executed through agents. It helps you identify and resolve issues that occur during agent-based pipeline execution that might not be visible through the standard interface.