Debugging Components
Learn how to debug actions, database operations, and Entity APIs.
Server-side Debugging
Designer logs help you debug your applications.
You can debug any Action, Database operation, or Entity API execution by checking the Execution > Enable Log Visualization property. This logs every execution of the action or API. These logs may be viewed from the Debug Log Viewer.
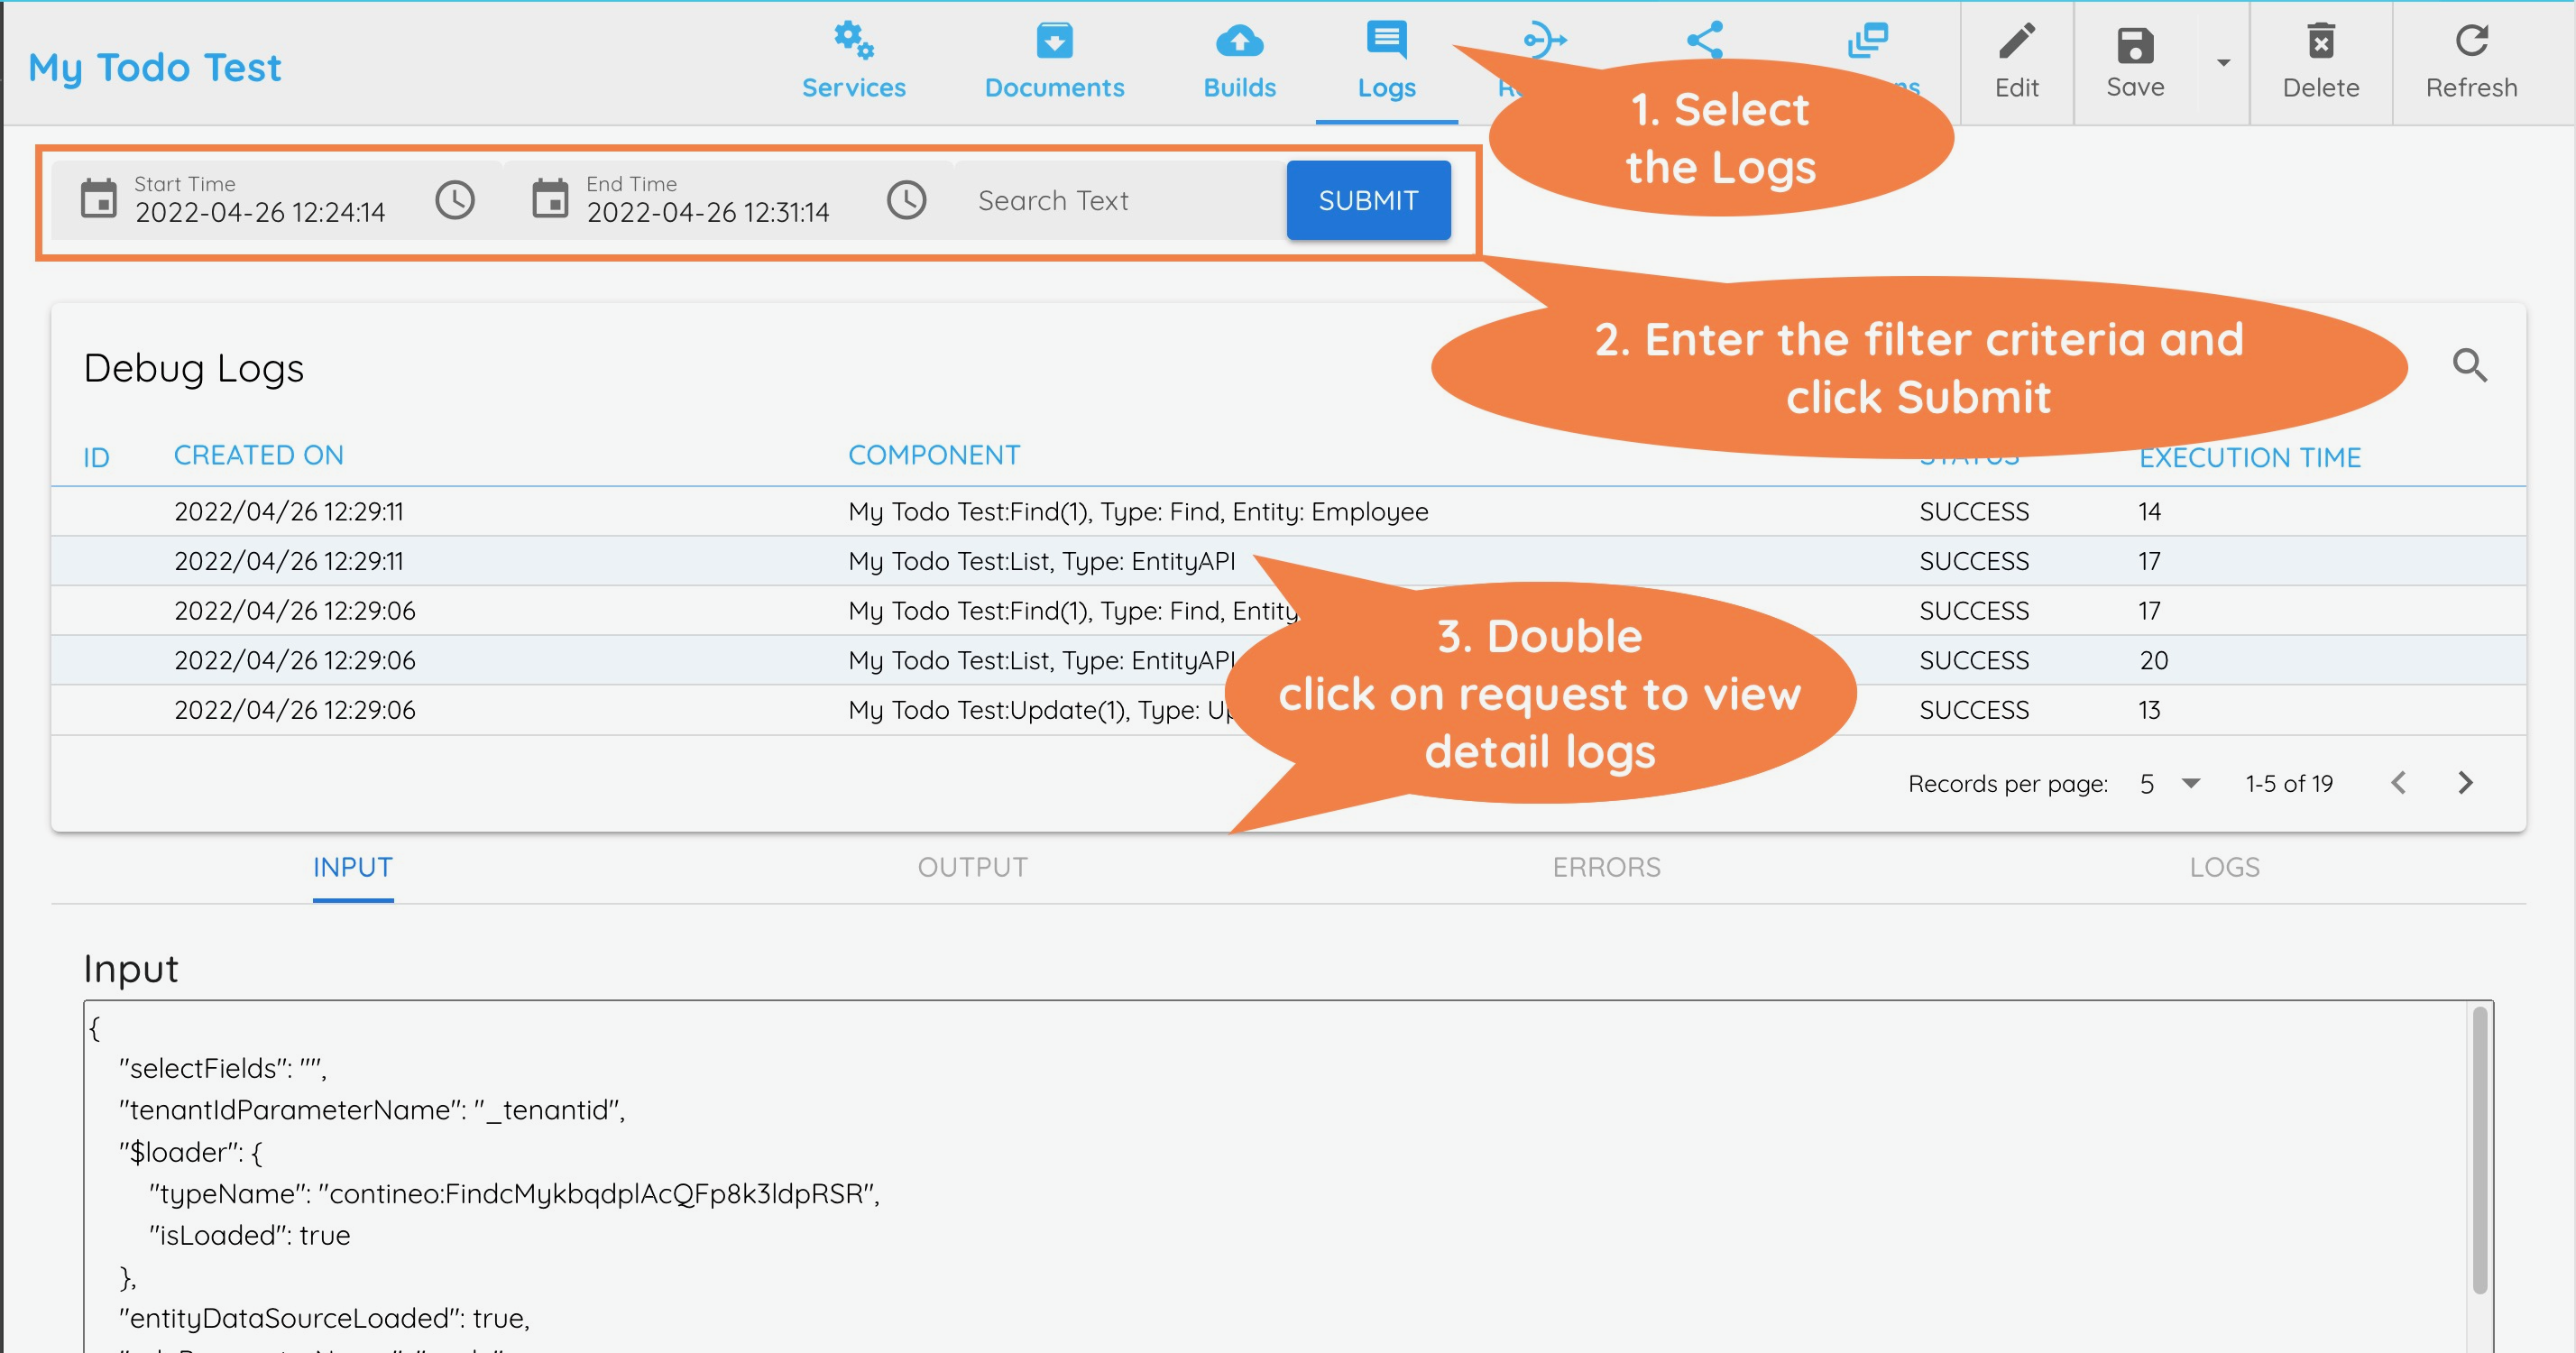
The Log Details section shows the following:
Input: Shows the input data sent to the action. Displays data in JSON format.
Output: Shows the output data from the action. For results that are an array, this section displays: The size of the List is: N
Errors: Shows any errors that occur during execution
Logs: This section shows the logs output for the action. Custom logs can be printed for JavaScript and Branch actions. To print custom logs, use:
context.log(message)
You can view the Debug Logs at the following levels:
Component | Logs Seen For |
|---|---|
Application | Shows logs for all actions, API, or Entity APIs run within the context of the application. |
Entity | Shows logs for all Entity APIs executed for this specific Entity. |
Action/DB Operation/Entity API | Shows logs for all executions of this component and components added to its process flow. |
Widget | Shows logs for all executions of actions added to the widget's model. |